It doesn’t say anything on how much more than $1,000 is spent. If in state a 2 out of 10 people spend $1,001 a year and the other 9 out of then $999 while in state b 1 out of 10 spends $2,000 a month and the other 9 out of 10 spend $999 then the stats show the are twice as many expensive in state a while in reality the only expensive cars are in state b
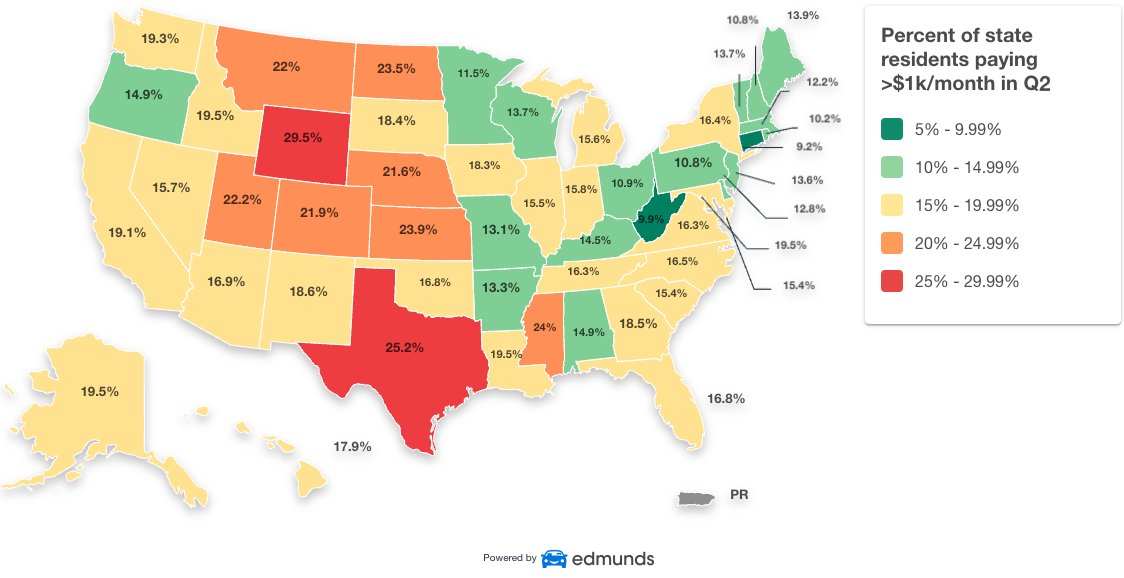
Why do people not understand how statistical statements work so often? The graphic shows one thing. It shows the percentage of residents who pay more than $1,000 a month on their car payments. That’s it. That’s all it’s claiming to show. That’s all it’s trying to show. That’s all it’s supposed to show. Getting mad that it doesn’t show 20 other aspects is ridiculous.

It doesn’t say anything on how much more than $1,000 is spent. If in state a 2 out of 10 people spend $1,001 a year and the other 9 out of then $999 while in state b 1 out of 10 spends $2,000 a month and the other 9 out of 10 spend $999 then the stats show the are twice as many expensive in state a while in reality the only expensive cars are in state b
Why do people not understand how statistical statements work so often? The graphic shows one thing. It shows the percentage of residents who pay more than $1,000 a month on their car payments. That’s it. That’s all it’s claiming to show. That’s all it’s trying to show. That’s all it’s supposed to show. Getting mad that it doesn’t show 20 other aspects is ridiculous.
Literally the first line of my comment is “it doesn’t say anything on how much more than $1,000 is spent”.
Not sure where you got the impression i’m mad about anything but ok.